
Credit Customer Analytics: Value, retention, and behaviour insight for lenders and fintechs grounded in credit risk discipline. Not all customers are equal — and the differences are not always visible until the portfolio is viewed through a rigorous analytical lens. With our support, Customer value and Churn insights are interpreted through the lens of credit risk for ensuring that retention and value strategies remain prudent and sustainable for organisations.
Customer Analytics connects risk to value, churn to retention and scoring to profit. Customer Lifetime Value, Churn Prediction and Segmentation has many use cases: targeting groups of potential customers in High-Middle-Low value segments for instance - an ideal input to marketing for acquisition, improving servicing standards, enhancing customer relationships or for identifying customer segments for retention strategies.
Disclaimer: The information is provided for mere information purposes as part of this blog. No responsibility or liability for any errors or omissions in the content of this site is assumed by Auriscon Ltd and Auriscon HK Ltd. The information contained in this site is provided with no guarantees of completeness and accuracy.
A working prototype developed to demonstrate the analytical approach uses simulated portfolio data to illustrate the approach:
-
Customer segmentation
-
Customer lifetime value
-
Churn driver analysis
-
Churn prediction
A practical first step is a short conversation about your own portfolio.
Grouping Customer Data

Segmentation reveals the hidden structure of the customer portfolio. It shows where value concentrates, where risk sits, and where the portfolio is comparatively unprofitable. Directing capital, attention, and pricing efforts towards the pockets of profitability is desirable for many organisations. Segmentation successfully groups customer data into HIGH - MIDDLE - LOW value segments in a risk-adjusted approach. Different methods can be used for this purpose. The purpose of segmentation is to identify, for instance with the aim to lever success of marketing channels when targeting chosen customer segments.
Customer Segmentation give management a stable map for decision-making. Clustering of customer data as a method enables identifying groups of customers that are similar in relation to the variables considered. Clustering is an unsupervised ML method with clusters being identified based on data alone. However, different methods can be used to segment customers into groups.
Evaluating Customer Lifetime Value

A customer represents rarely a single transaction, rather a stream of future cash flows that that must be measured net of risk. Lifetime customer value highlights the risk-adjusted worth of customers - an evaluation that reveals which relationships justify acquisition cost, retention effort, and the time and attention of the relationship manager.
Customer Lifetime Value (CLV) quantifies the worth of customers over time in a risk-adjusted way by accounting for the revenue and cost aspects of customer value, alongside retention. For credit risky customers, a break-down by interest margin and the fee income is used for the Revenue dimension, whilst a breakdown into capital cost, risk cost and operating cost is used for the Cost dimension. The Retention dimension has to be accounted for by drawing the right input from a Churn prediction model.
Suggested benefits of using a comprensive Customer Value Analytics including CLV from the Credit Risk perspective are logically convincing:
- A Look-through years of modest profitability with identification of the high value relationship the customers worth nurturing.
- A reduction in the spending on customers who will not repay in terms of expected profitability.
- An enhancement in risk-adjusted pricing and capital allocation through the lense of customer value and profitability.
Analyzing Customer Churn
 Churn rarely arrives without warning. It leaves traces in behaviour before the customer leaves. Customer churn occurs when customers stop doing business with acompany. Churn driver analysis uncovers the early signals — declining activity, lower engagement, reduced product usage, service friction — that precede attrition. It explains why customers weaken, not just that they leave. Apparently, the impact of churn is negative, either through a loss of customers or through a loss of revenue. Certainly, the definition of churn that is operational in an organization is important to agree upon, before a list of the top customers likely to churn can be generated. A natural follow-up is to develop retention strategies in conjunction with the company’s retention and relationship teams.
Benefits through Customer Churn Analysis can be recognized through the following actions:
- Relate retention strategies and retention spending on churn causes that actually matter.
- Protect high-value relationships before they are lost.
-
Prevent the hidden cost of silent attrition creeping in even in seemingly stable portfolios and benign markets.
Definition of churn depends on the business model of companies: businesses that are subscription based encounter churn in terms of cancellations of subsriptions, whereas businesses that are based on recurring purchases encounter churn when customers refrain from buying any additional products or services for more than x months.
Understanding the drivers of churn is an important precondition before strategies to prevent churn can realistically be effective:
- Churn analysis is demonstrated on a dataset of 10000 Bank Churners obtained from Kaggle.


- Inspection of data reveals outliers for variables Age and CreditScore.
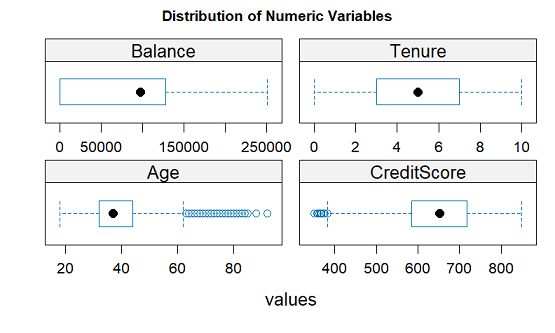
- The subset of churners in the data display central tendencies.

- For example, the churn rate of customers may vary by segment, dependent on the number of previous purchases. The data driven approach provides the rationale associated to critical segments with customers at higher risk for churn.
Predicting Customer Churn
The real commercial power of analytics is not hindsight. It is the ability to act before the loss occurs. Churn prediction turns behavioural signals into a forward-looking score. It identifies which high-value customers are most likely to leave within a defined horizon, allowing proactive intervention. Features commonly considered include product tenure, number of products, transaction frequency, recent decline in usage, complaints or service interactions, and digital engagement. Methods include logistic regression, Naive Bayes, random forests, and boosted tree ensembles.
 Analytical methods used for prediction of customer churn draw from AI based approaches: (1) Logistic Regression which is a method commonly used for predicting binary outcomes. (2) Naive Bayes which is a classification method based on simplistic assumptions. (3) Random Forest and Boosted Trees which are classification methods that use an ensemble approach for estimation.
The Output of any of these approaches is a prediction about customer churn over the chosen time horizon e.g. next 12 months, together with the top list of churners and the drivers of churn. A practical first step is a short conversation about your own portfolio and your organisation's strategy to boost retention:
-
Reducing revenue leakage from churn of valuable clients
-
Improving retention campaign efficiency
-
Providing early-warning discipline often missing in SME and fintech portfolios.
Example: Ensemble techniques compare favourably to single Model techniques such as Logistic Regression. Techniques such a Random Forests and Gradient Boosting Trees provide superior performance due to combining multiple regression or decision trees whilst accounting for non-linear relationships between variables. Random Forest approach use an ensemble of trees to arrive at robust estimators that avoid overfitting and work well on new data. For estimation, the data are split into training and test data sets with the Model being trained and validated on separate data sets. The Random Forests Model consists of a large number of trees with classifications for being assigned to the segment that receives the majority of votes from the ensemble. Noteworthy that for classification problems the dependent variable is of categorical type and is cast as a factor.